Go总结(十八)| pprof性能分析
Go语言提供了很多性能分析的工具,性能分析类型有如下几种:
- CPU性能分析
- 内存性能分析
- 阻塞性能分析
- 锁性能分析
CPU性能分析
生成profile文件
Go 的运行时性能分析接口都位于 runtime/pprof 包中。只需要调用 runtime/pprof 库即可得到我们想要的数据。
看下面的例子,随机生成了 5 组数据,并且使用冒泡排序法排序:
|
|
用下面的命令生成文件,或者取消注释上面的两行代码,直接生成文件:
# 手工导出文件
$ go run main.go > cpu.pprof
# 直接生成文件
$ go run main.go
分析数据
用Go自带的分析工具:
$ go tool pprof -http=:1234 cpu.pprof
如果提示 Graphviz 没有安装,则通过 brew install graphviz(MAC) 或 apt install graphviz(Ubuntu) 即可,或者windows下载:http://www.graphviz.org/download/
注意:可能需要重启系统,否则命令报错。
网页浏览器中查看的结果,可以换不通的视图(可以点击Title排序):

除了网页分析数据之外,也可以在命令行中使用交互模式查看:
>go tool pprof cpu.pprof
Type: cpu
Time: Jan 23, 2021 at 6:03pm (CST)
Duration: 10.88s, Total samples = 10.75s (98.83%)
Entering interactive mode (type "help" for commands, "o" for options)
(pprof) top
Showing nodes accounting for 10.70s, 99.53% of 10.75s total
Dropped 1 node (cum <= 0.05s)
      flat  flat%   sum%        cum   cum%
    10.70s 99.53% 99.53%     10.75s   100%  yufa/demo/cpprof.bubbleSort
         0     0% 99.53%     10.75s   100%  main.main
         0     0% 99.53%     10.75s   100%  runtime.main
         0     0% 99.53%     10.75s   100%  yufa/demo/cpprof.BubbleTest
可以看到 main.bubbleSort 是消耗 CPU 最多的函数。
还可以按照 cum (累计消耗)排序:
(pprof) top --cum
Showing nodes accounting for 10.70s, 99.53% of 10.75s total
Dropped 1 node (cum <= 0.05s)
      flat  flat%   sum%        cum   cum%
         0     0%     0%     10.75s   100%  main.main
         0     0%     0%     10.75s   100%  runtime.main
         0     0%     0%     10.75s   100%  yufa/demo/cpprof.BubbleTest
    10.70s 99.53% 99.53%     10.75s   100%  yufa/demo/cpprof.bubbleSort
help 可以查看所有支持的命令和选项:
(pprof) help
  Commands:
    callgrind        Outputs a graph in callgrind format
    comments         Output all profile comments
    disasm           Output assembly listings annotated with samples
    dot              Outputs a graph in DOT format
    eog              Visualize graph through eog
    evince           Visualize graph through evince
    gif              Outputs a graph image in GIF format
    gv               Visualize graph through gv
......
内存性能分析
生成profile
生成长度为 N 的随机字符串,拼接在一起:
|
|
接下来,我们使用一个易用性更强的库 pkg/profile 来采集性能数据,pkg/profile 封装了 runtime/pprof 的接口,使用起来更简单。当然想度量 concat() 的 CPU 性能数据也是可以的,只需要取消上面一行代码注释即可生成 profile 文件。
运行:go run main.go
会生成相应的分析结果数据,比如我们这里是mem.pprof
分析数据
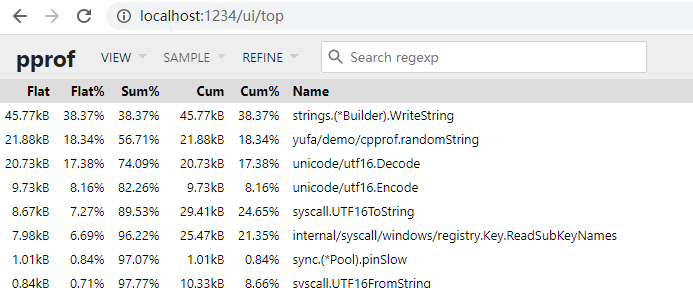
按照以前的方法,在浏览器中查看内存使用数据报告:
go tool pprof -http=:1234 mem.pprof

从这张图中,我们可以看到 concat 消耗了 524k 内存,randomString 仅消耗了 22k 内存。理论上,concat 函数仅仅是将 randomString 生成的字符串拼接起来,消耗的内存应该和 randomString 一致,但怎么会产生 20 倍的差异呢?这和 Go 语言字符串内存分配的方式有关系。字符串是不可变的,因为将两个字符串拼接时,相当于是产生新的字符串,如果当前的空间不足以容纳新的字符串,则会申请更大的空间,将新字符串完全拷贝过去,这消耗了 2 倍的内存空间。在这 100 次拼接的过程中,会产生多次字符串拷贝,从而消耗大量的内存。
那就改进。
使用 strings.Builder 替换 + 进行字符串拼接,将有效地降低内存消耗。
|
|
同样的方式查看分析结果数据,如下图:
可以看到,使用 strings.Builder 后,concat 内存消耗降为了原来的 1/11。
benchmark生成profile
benchmark除了直接在命令行中查看测试的结果外,也可以生成 profile 文件,使用 go tool pprof 分析。
testing 支持生成 cpu、memory 和 block 的 profile 文件:
- -cpuprofile=$FILE
- -memprofile=$FILE, -memprofilerate=N 调整记录速率为原来的 1/N。
- -blockprofile=$FILE
例如:go test -bench="Fib$" -cpuprofile=cpu.pprof .
另外
使用 -text 选项可以直接将结果以文本形式打印出来。pprof 支持多种输出格式(图片、文本、Web等),直接在命令行中运行 go tool pprof 即可看到所有支持的选项:
$ go tool pprof

Details:
  Output formats (select at most one):
    -dot             Outputs a graph in DOT format
    -png             Outputs a graph image in PNG format
	-text            Outputs top entries in text form
    -tree            Outputs a text rendering of call graph
    -web             Visualize graph through web browser
	......
比如使用go tool pprof -text cpu.pprof
(完)
- 原文作者: 闪电侠
- 原文链接:https://chende.ren/2021/01/23175227-018-pprof.html
- 版权声明:本作品采用 开放的「署名 4.0 国际 (CC BY 4.0)」创作共享协议 进行许可